Selected R-based work connecting analytical methods with interpretable business questions. All three projects were completed in 2025.
01 / R · K-means · Hierarchical clustering · 2025
Australian occupation clustering
The question
How do occupations differ when employment, earnings and education are considered together?
What I did
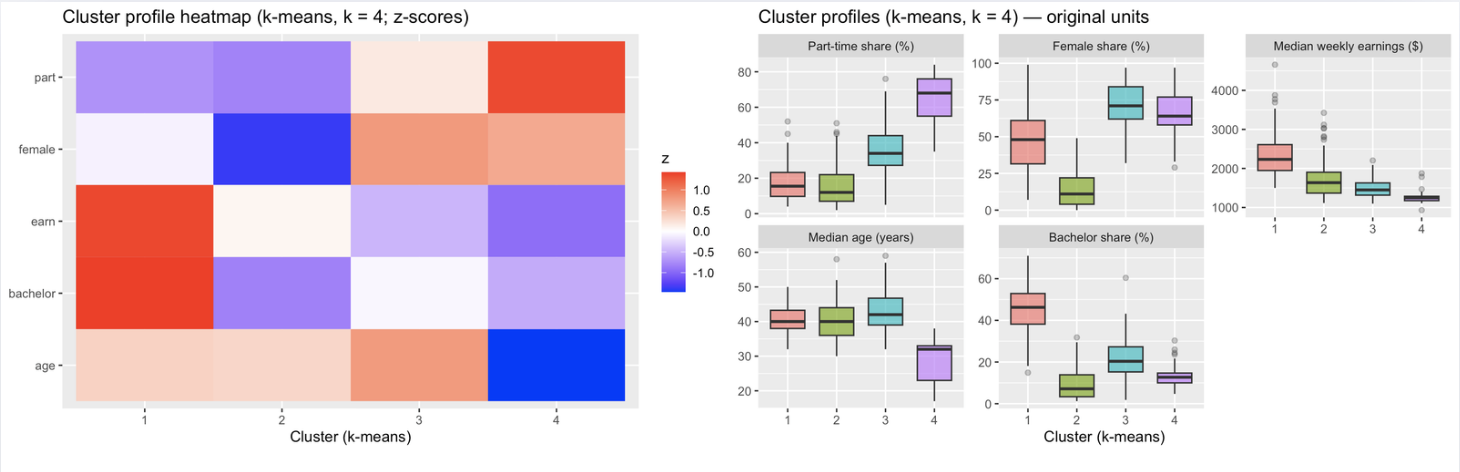
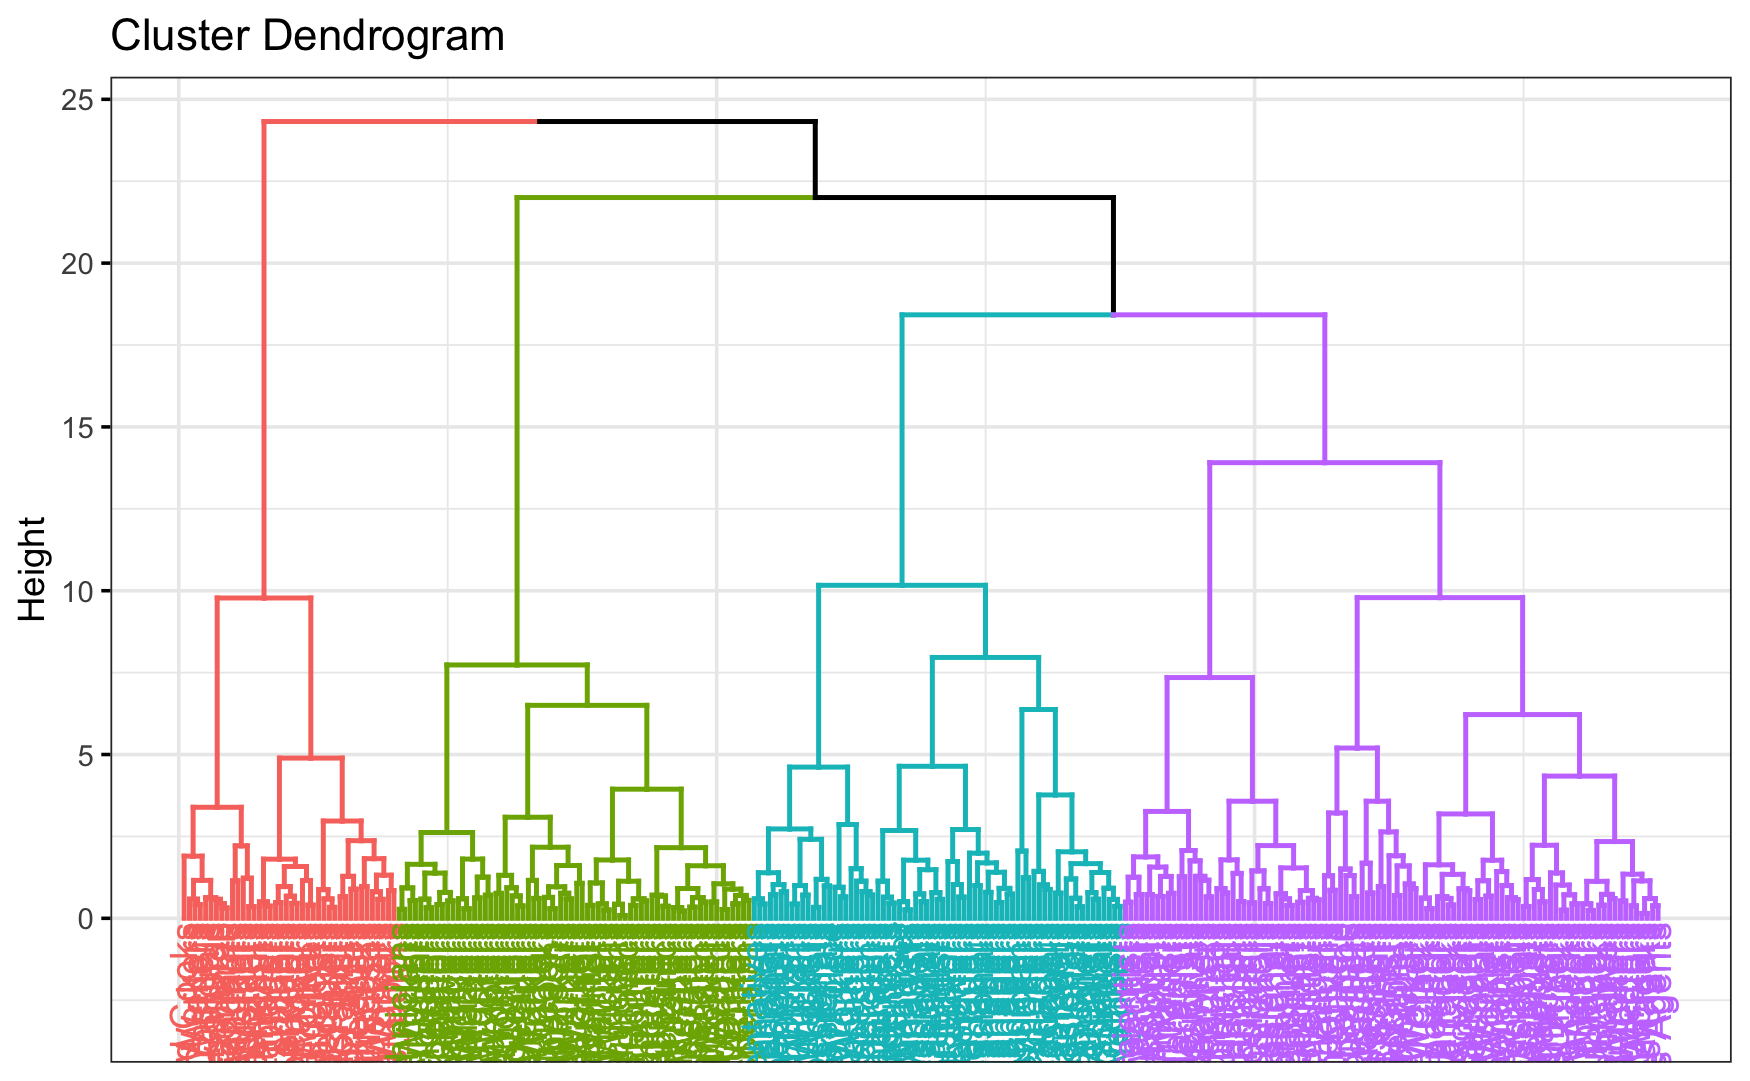
Integrated and standardised Australian occupation data, then applied K-means and hierarchical clustering. Visualised the resulting profiles using charts, heatmaps and box plots.
What it tells us
The analysis identified distinct multivariate occupation profiles. These are descriptive groups, not forecasts of growth or automation risk.
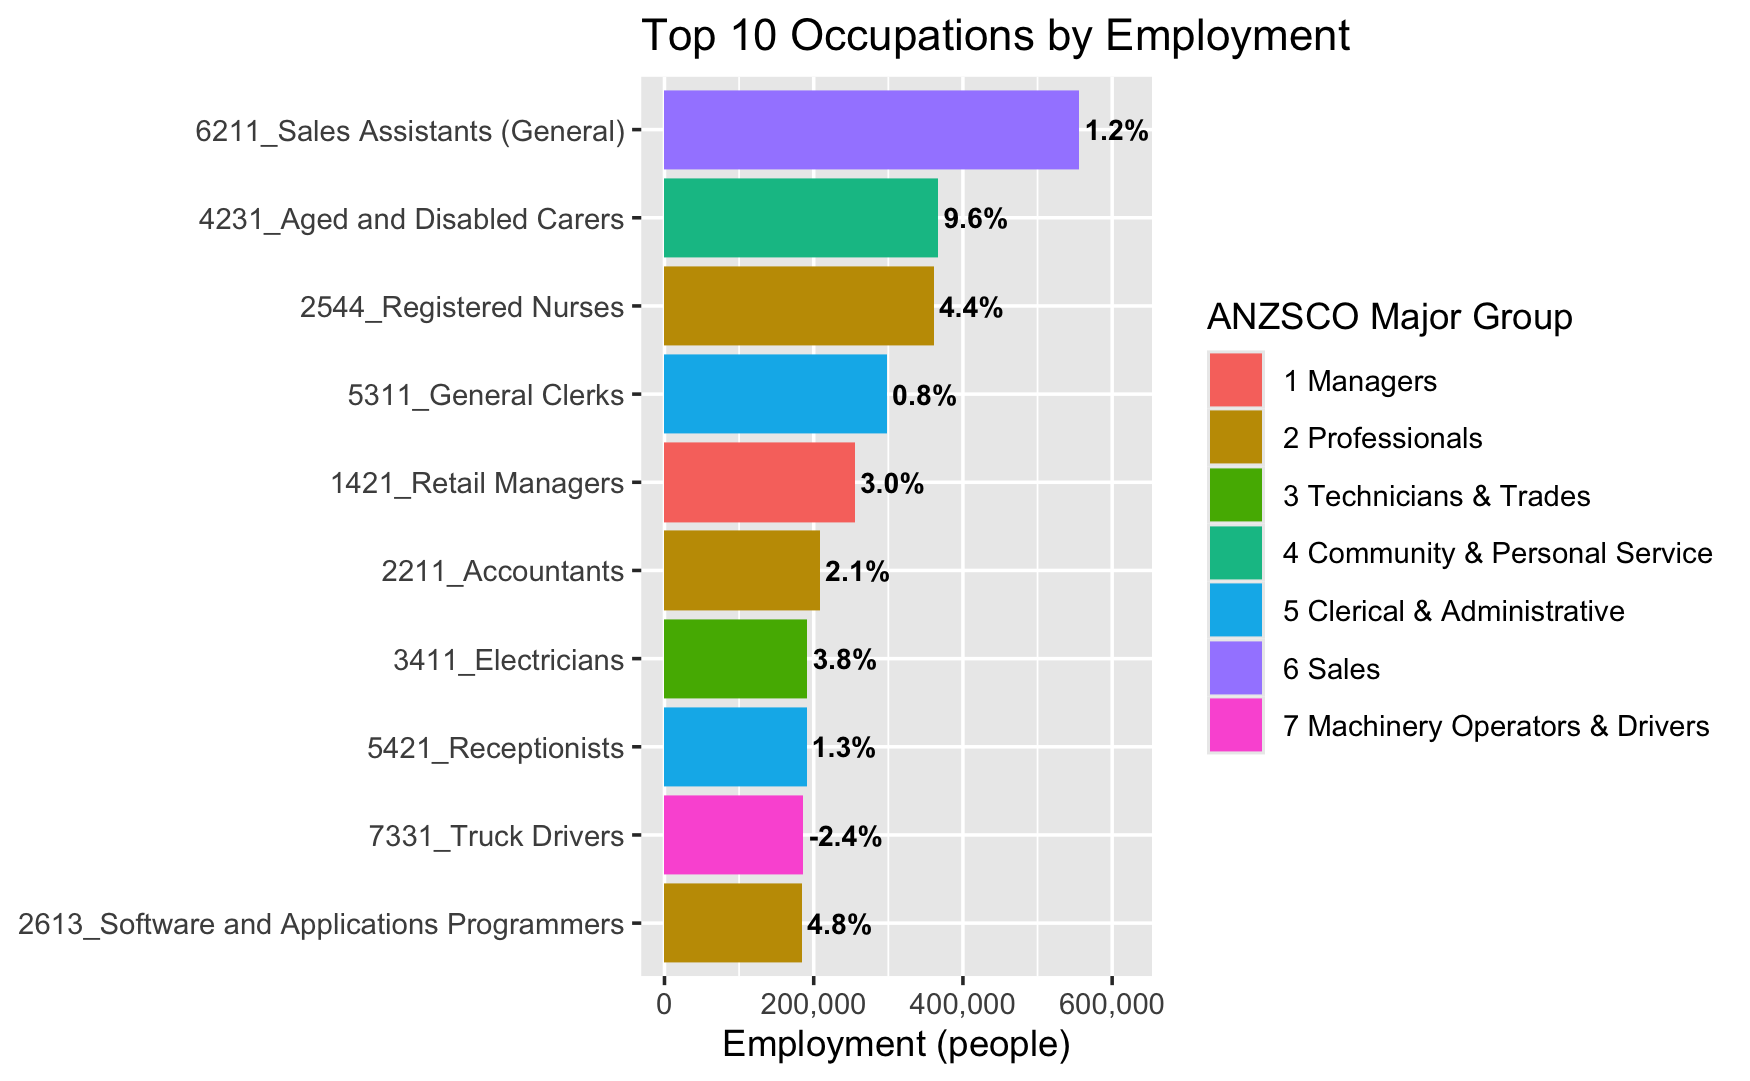
Cluster profiles: standardised heatmap and original-unit box plots.Top 10 occupations by employment.Hierarchical clustering dendrogram.
02 / R · Time series · Data visualisation · 2025
Electricity demand time series
The question
How does electricity demand change across the day, the week and unusual events?
What I did
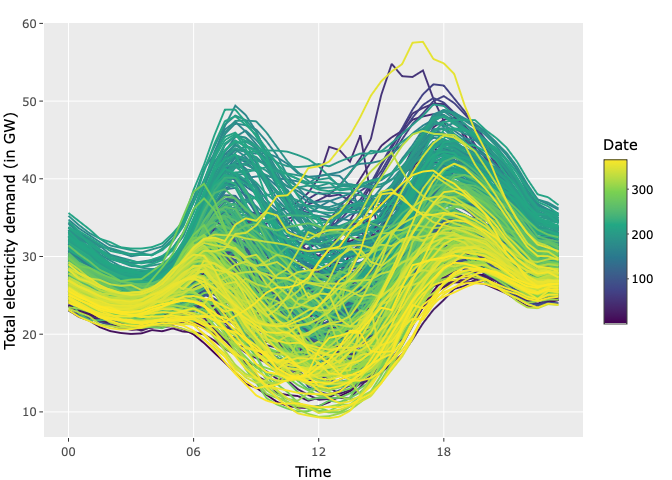
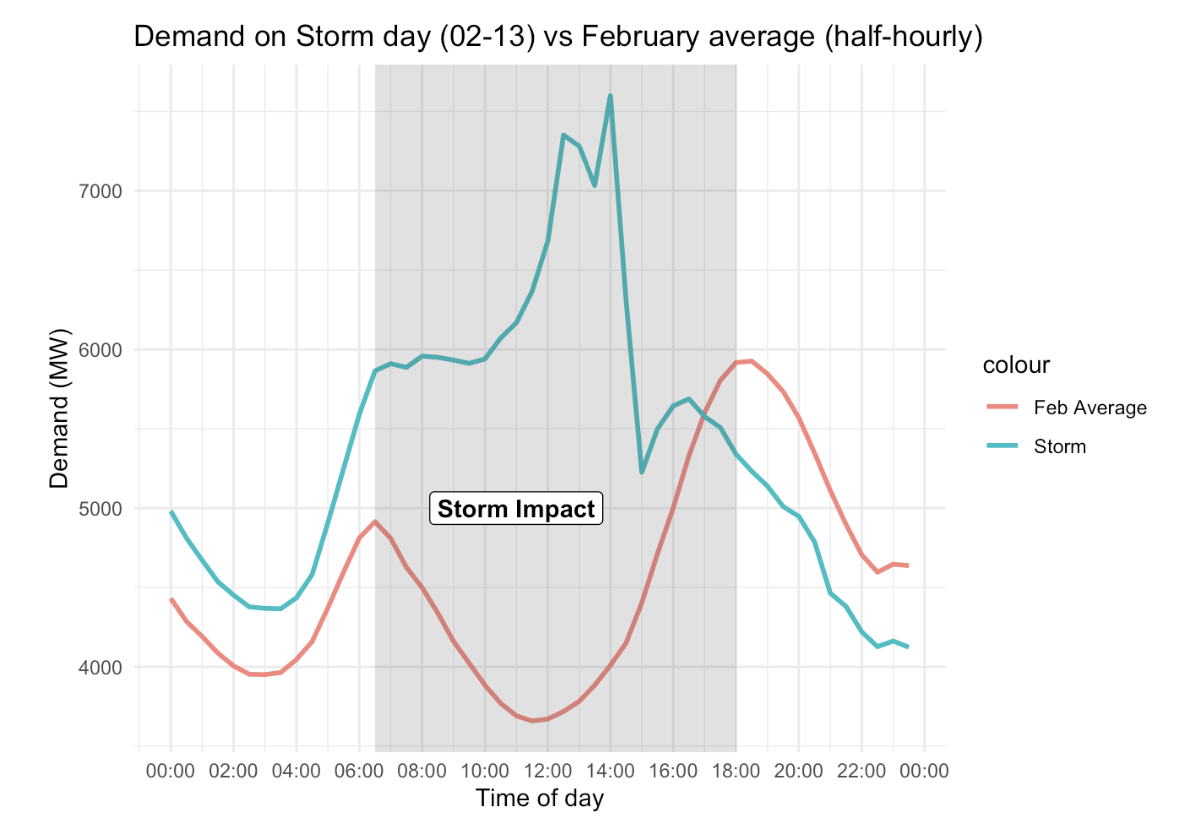
Analysed half-hourly Australian electricity-demand data, visualised daily, weekly and monthly patterns, and compared a storm-event day with typical February demand profiles.
What it tells us
The work describes observed demand patterns and abnormal periods. It does not claim a forecasting model or isolate the causal effect of the storm.
Electricity-demand profiles across the day.Storm-day demand compared with the February average.
03 / R · Market analysis · ROI · 2025
Movie market analytics
The question
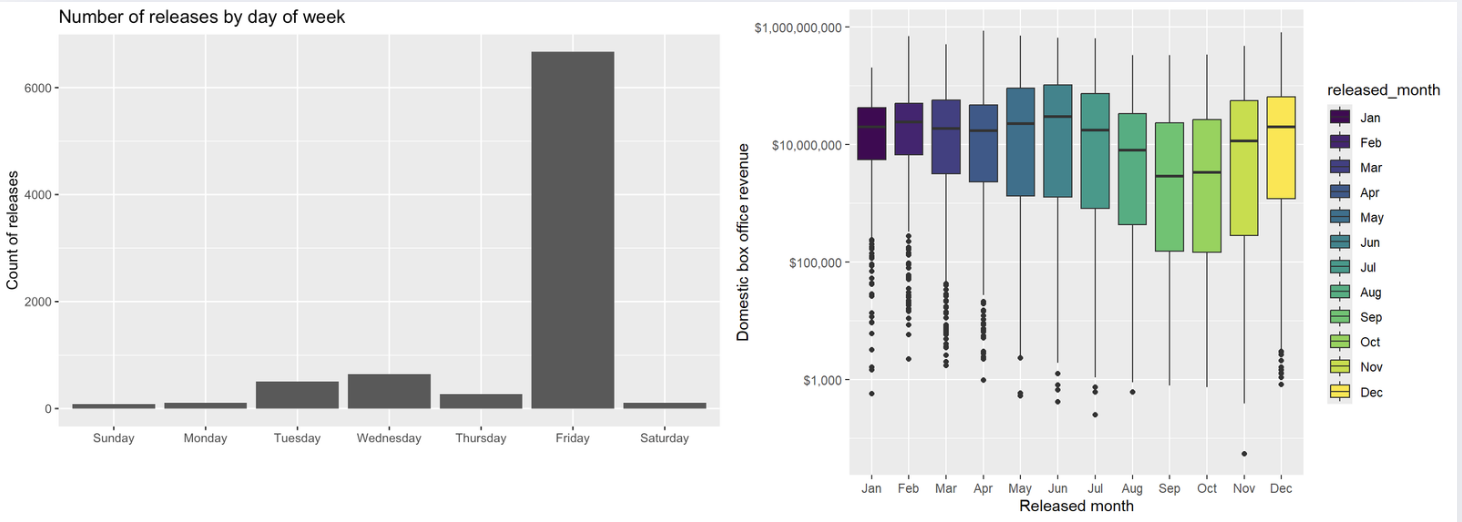
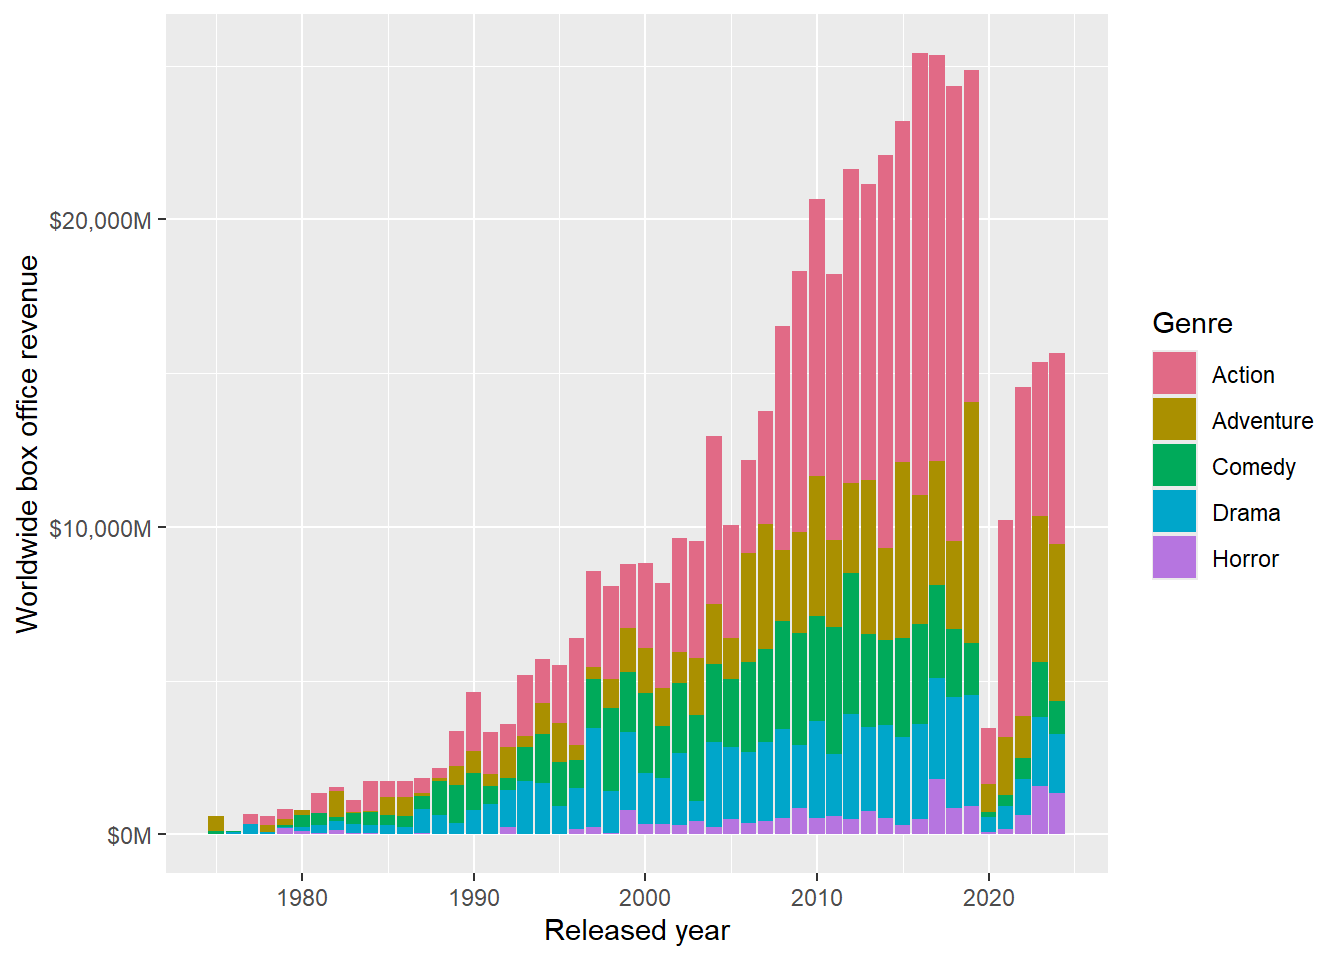
How are genre, release timing and budget associated with box-office performance?
What I did
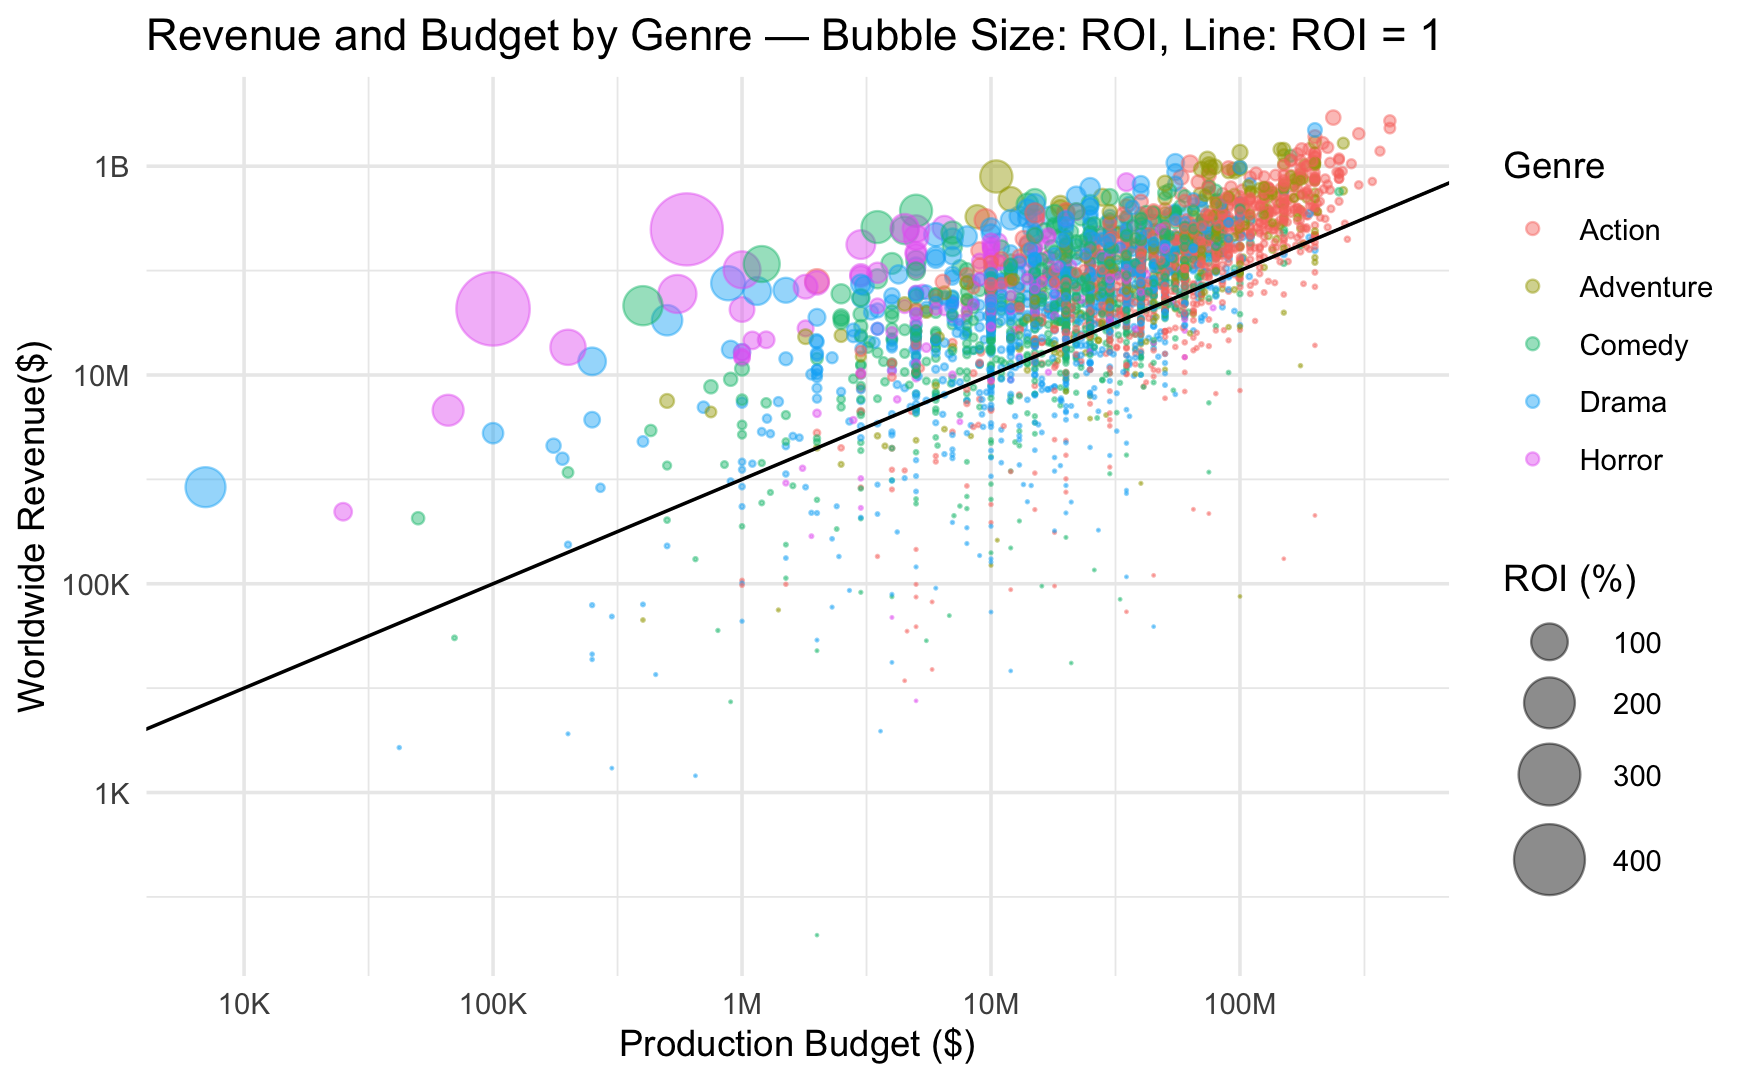
Integrated movie budget and box-office datasets to examine relationships between genre, release timing, budget, revenue and ROI.
What it tells us
Results are observed associations. Box-office-based ROI is a comparison measure and does not represent audited film profitability.
Movie budgets, worldwide revenue and box-office-based ROI.Release timing: day-of-week counts and monthly revenue distributions.Worldwide box-office revenue by genre and release year.
Additional Power BI dashboard experience is included in my skill set; the case studies here are R-based.